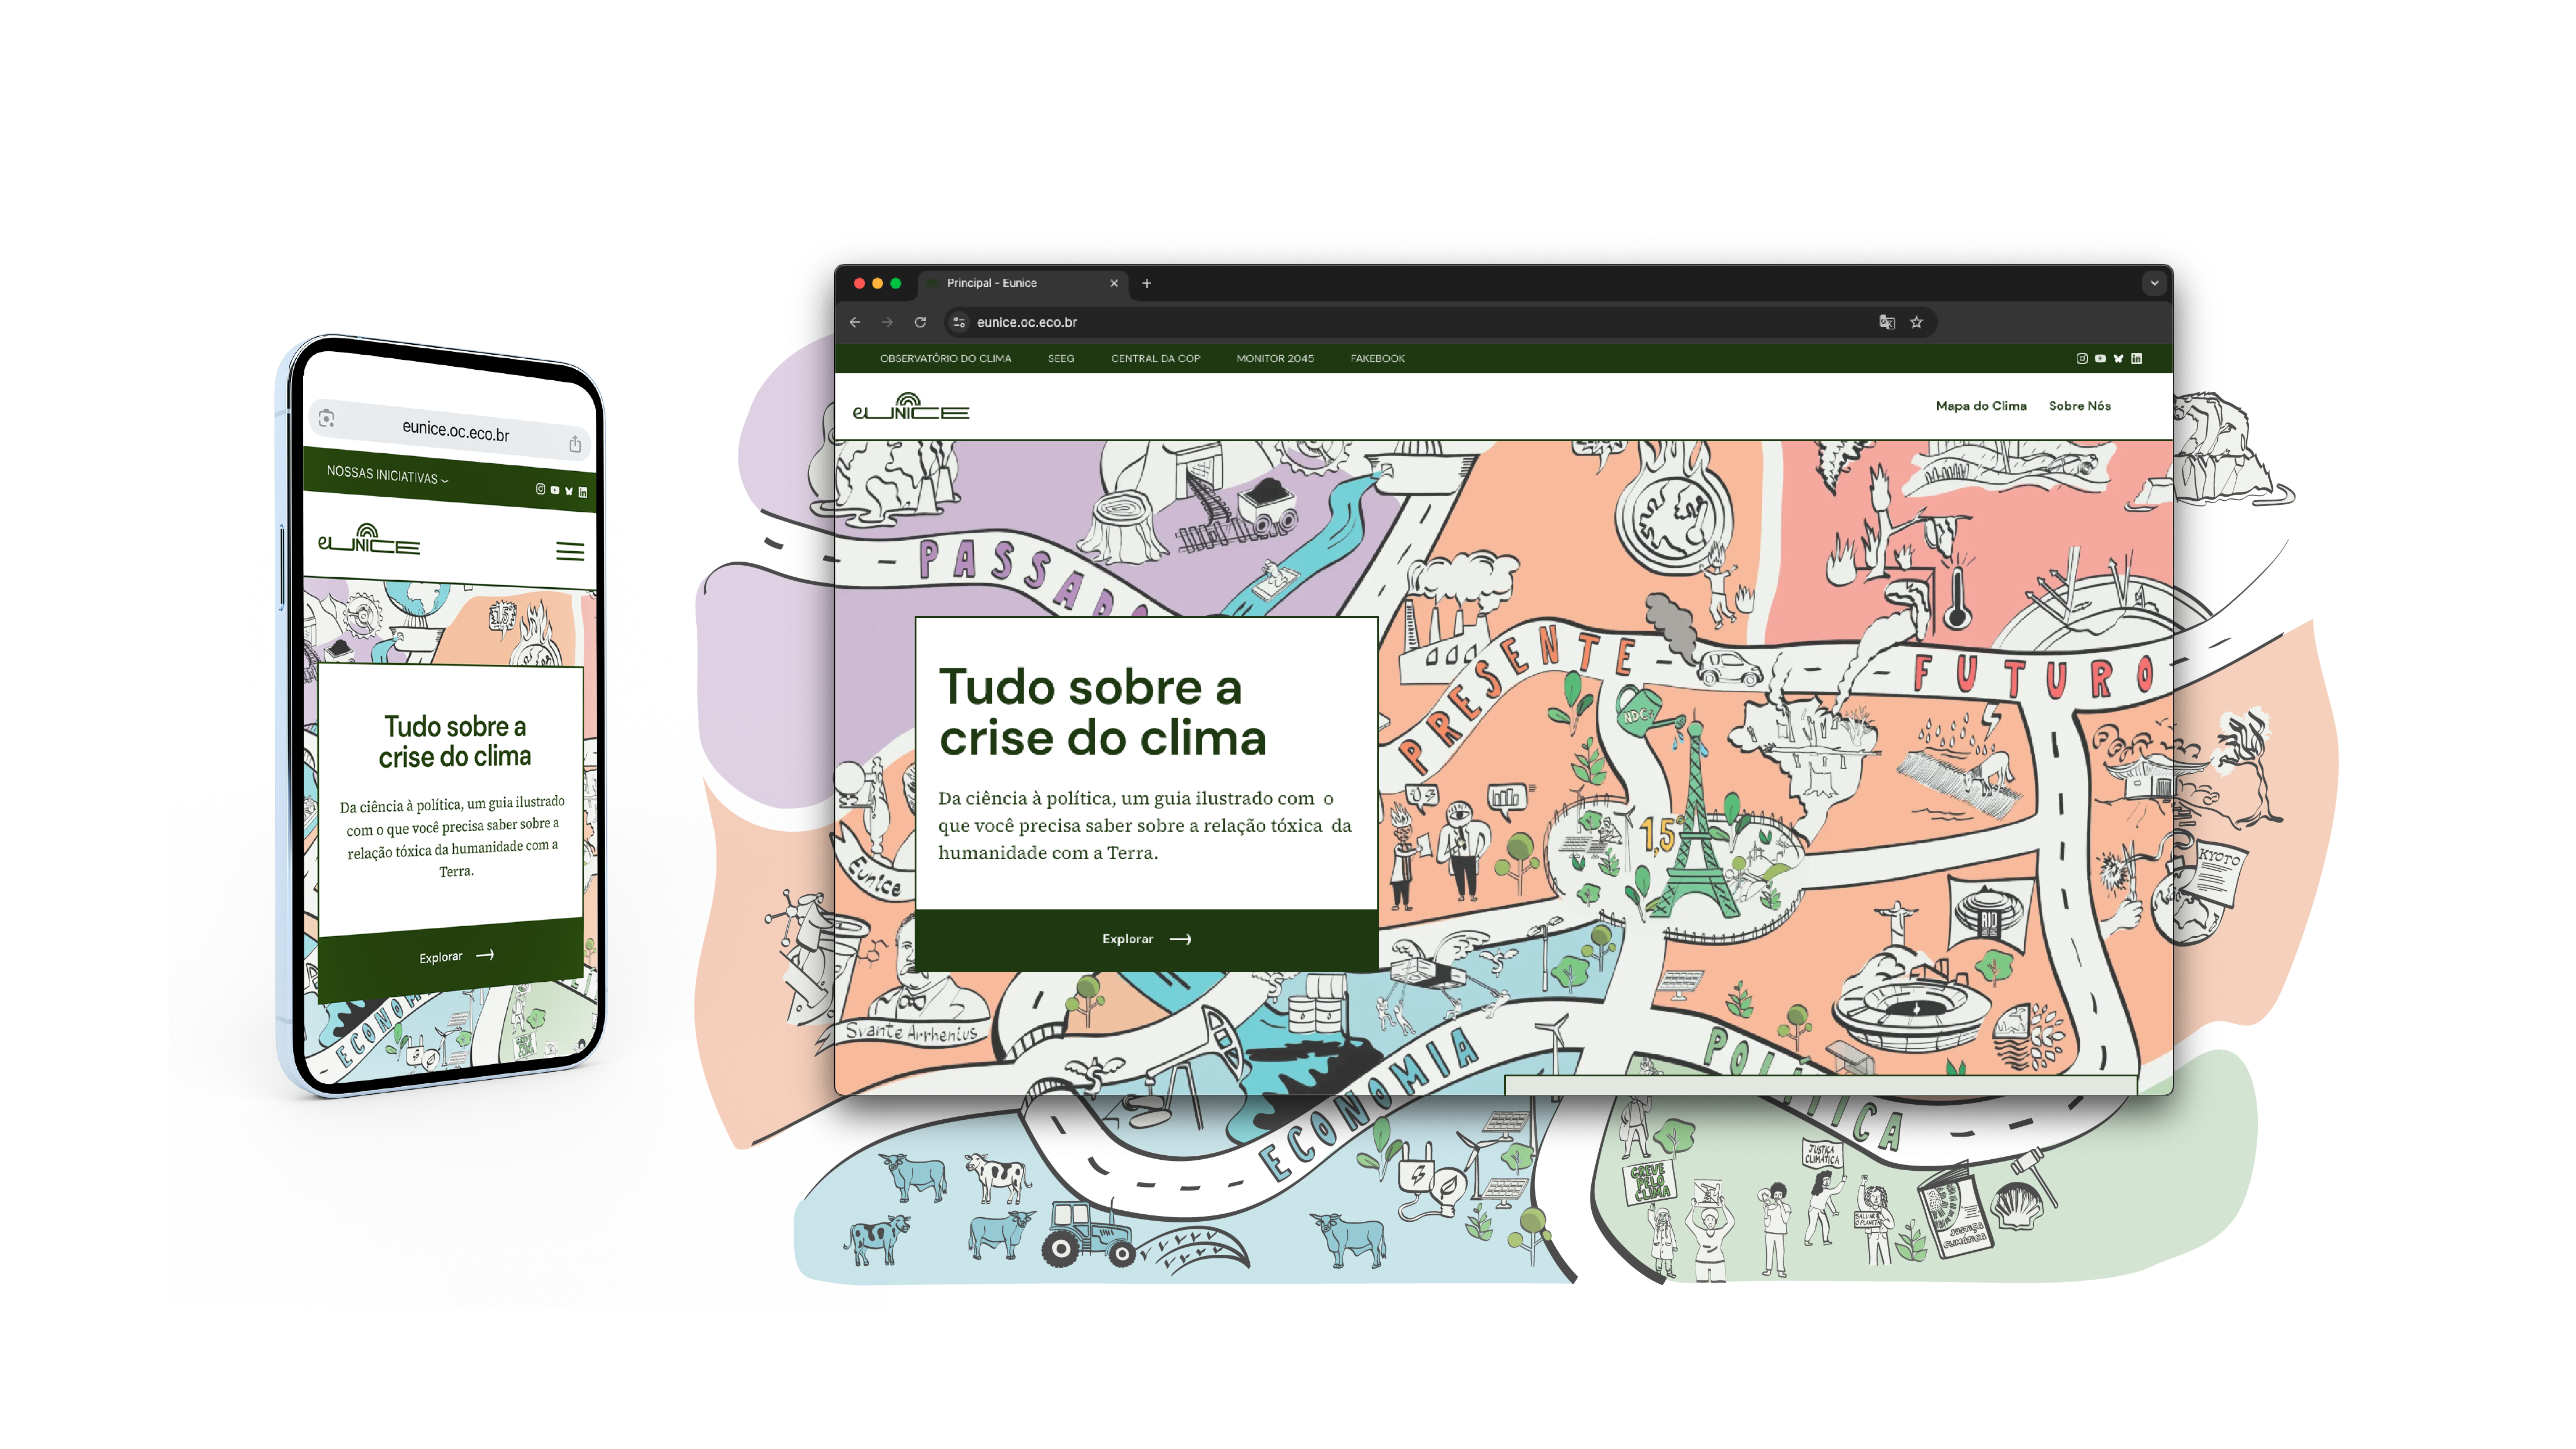
Eunice is an illustrated platform created to expand access to information about the climate crisis.
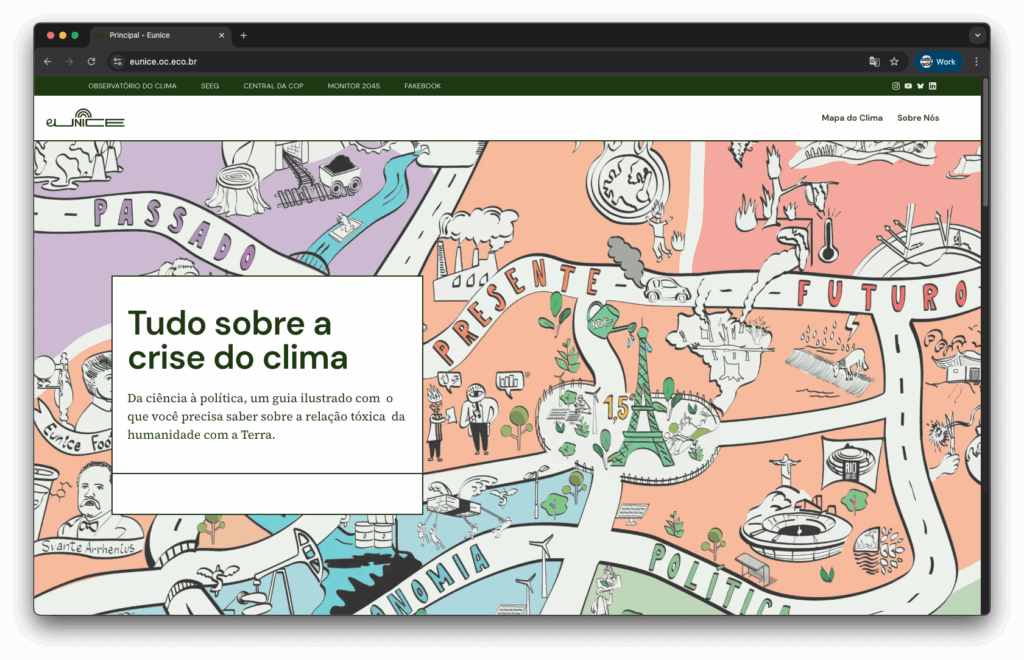
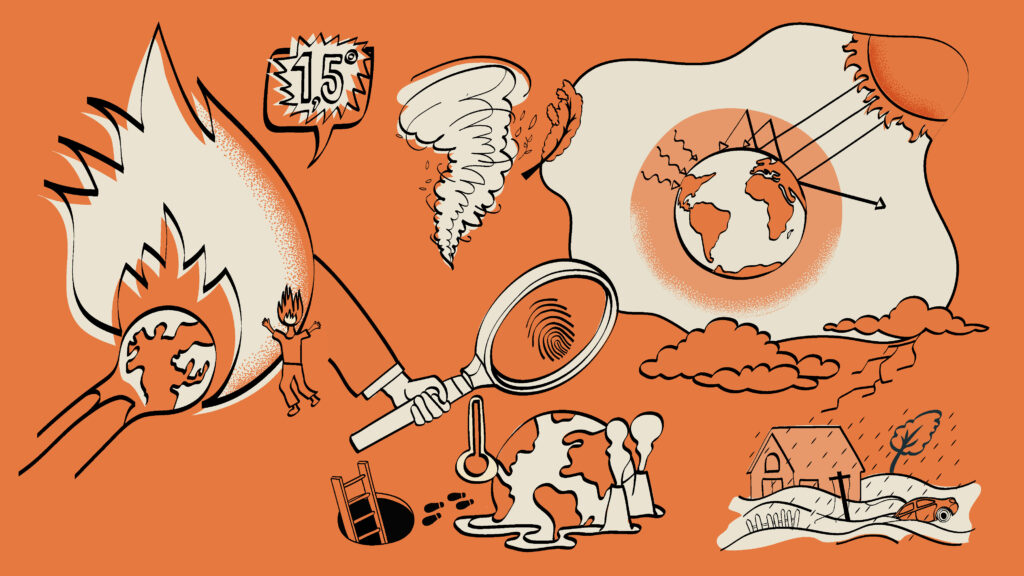
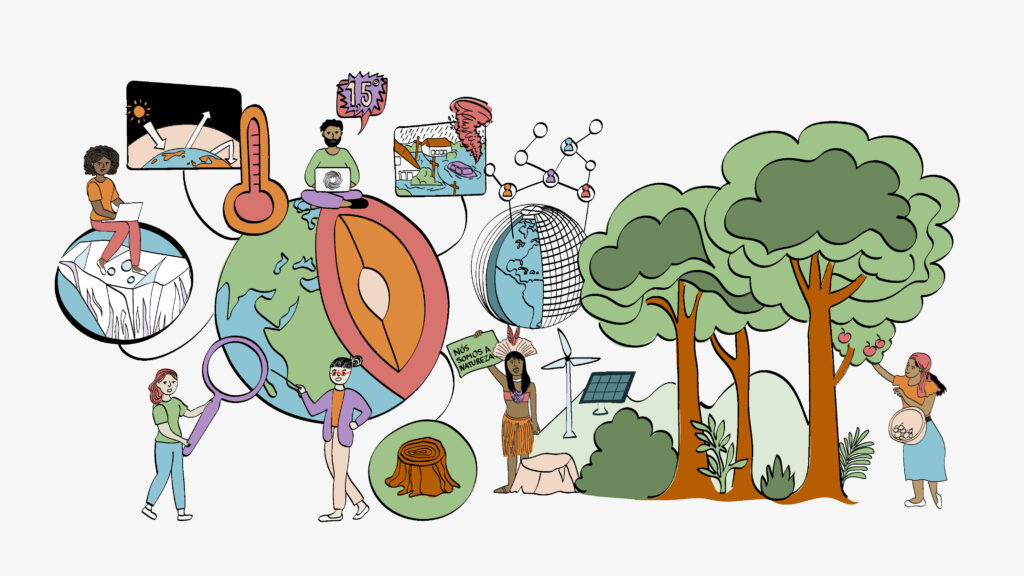
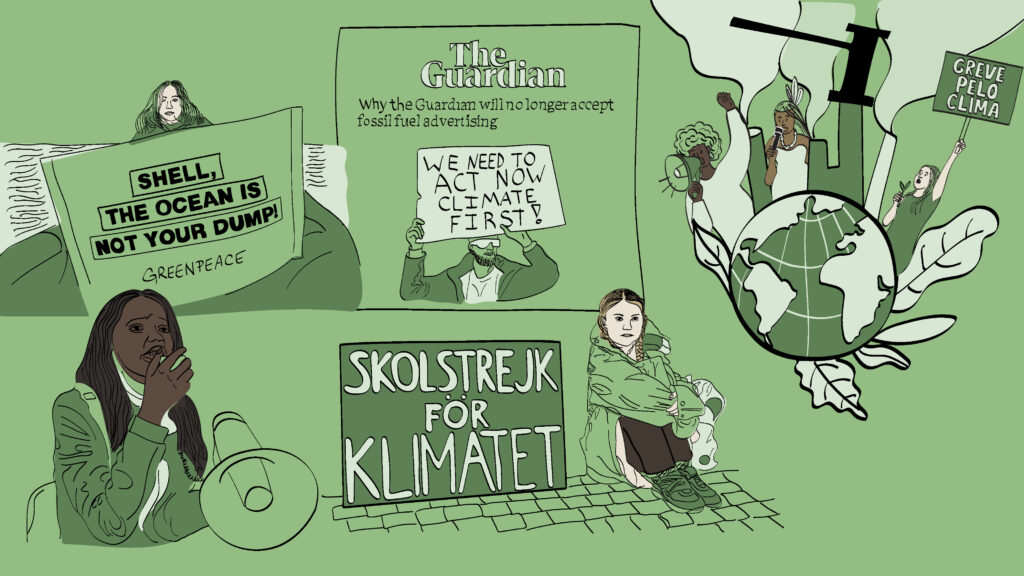
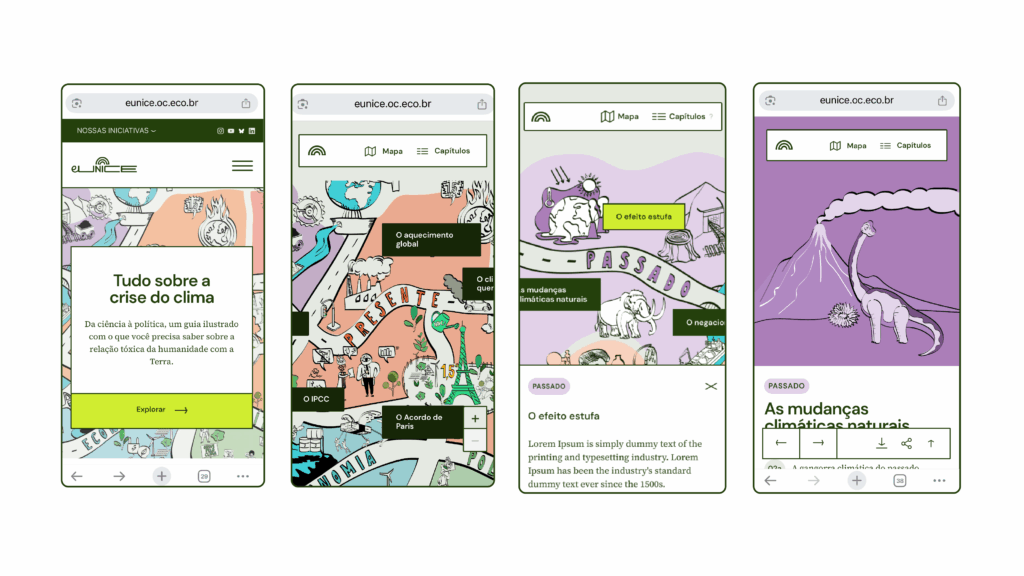
We illustrated an interactive map of a city that features key moments in the history of the global climate, divided into five “neighborhoods”: past, present, future, economy, and politics. The map invites users to explore topics such as the history of global warming, climate conventions, denialism, civil society, and more.
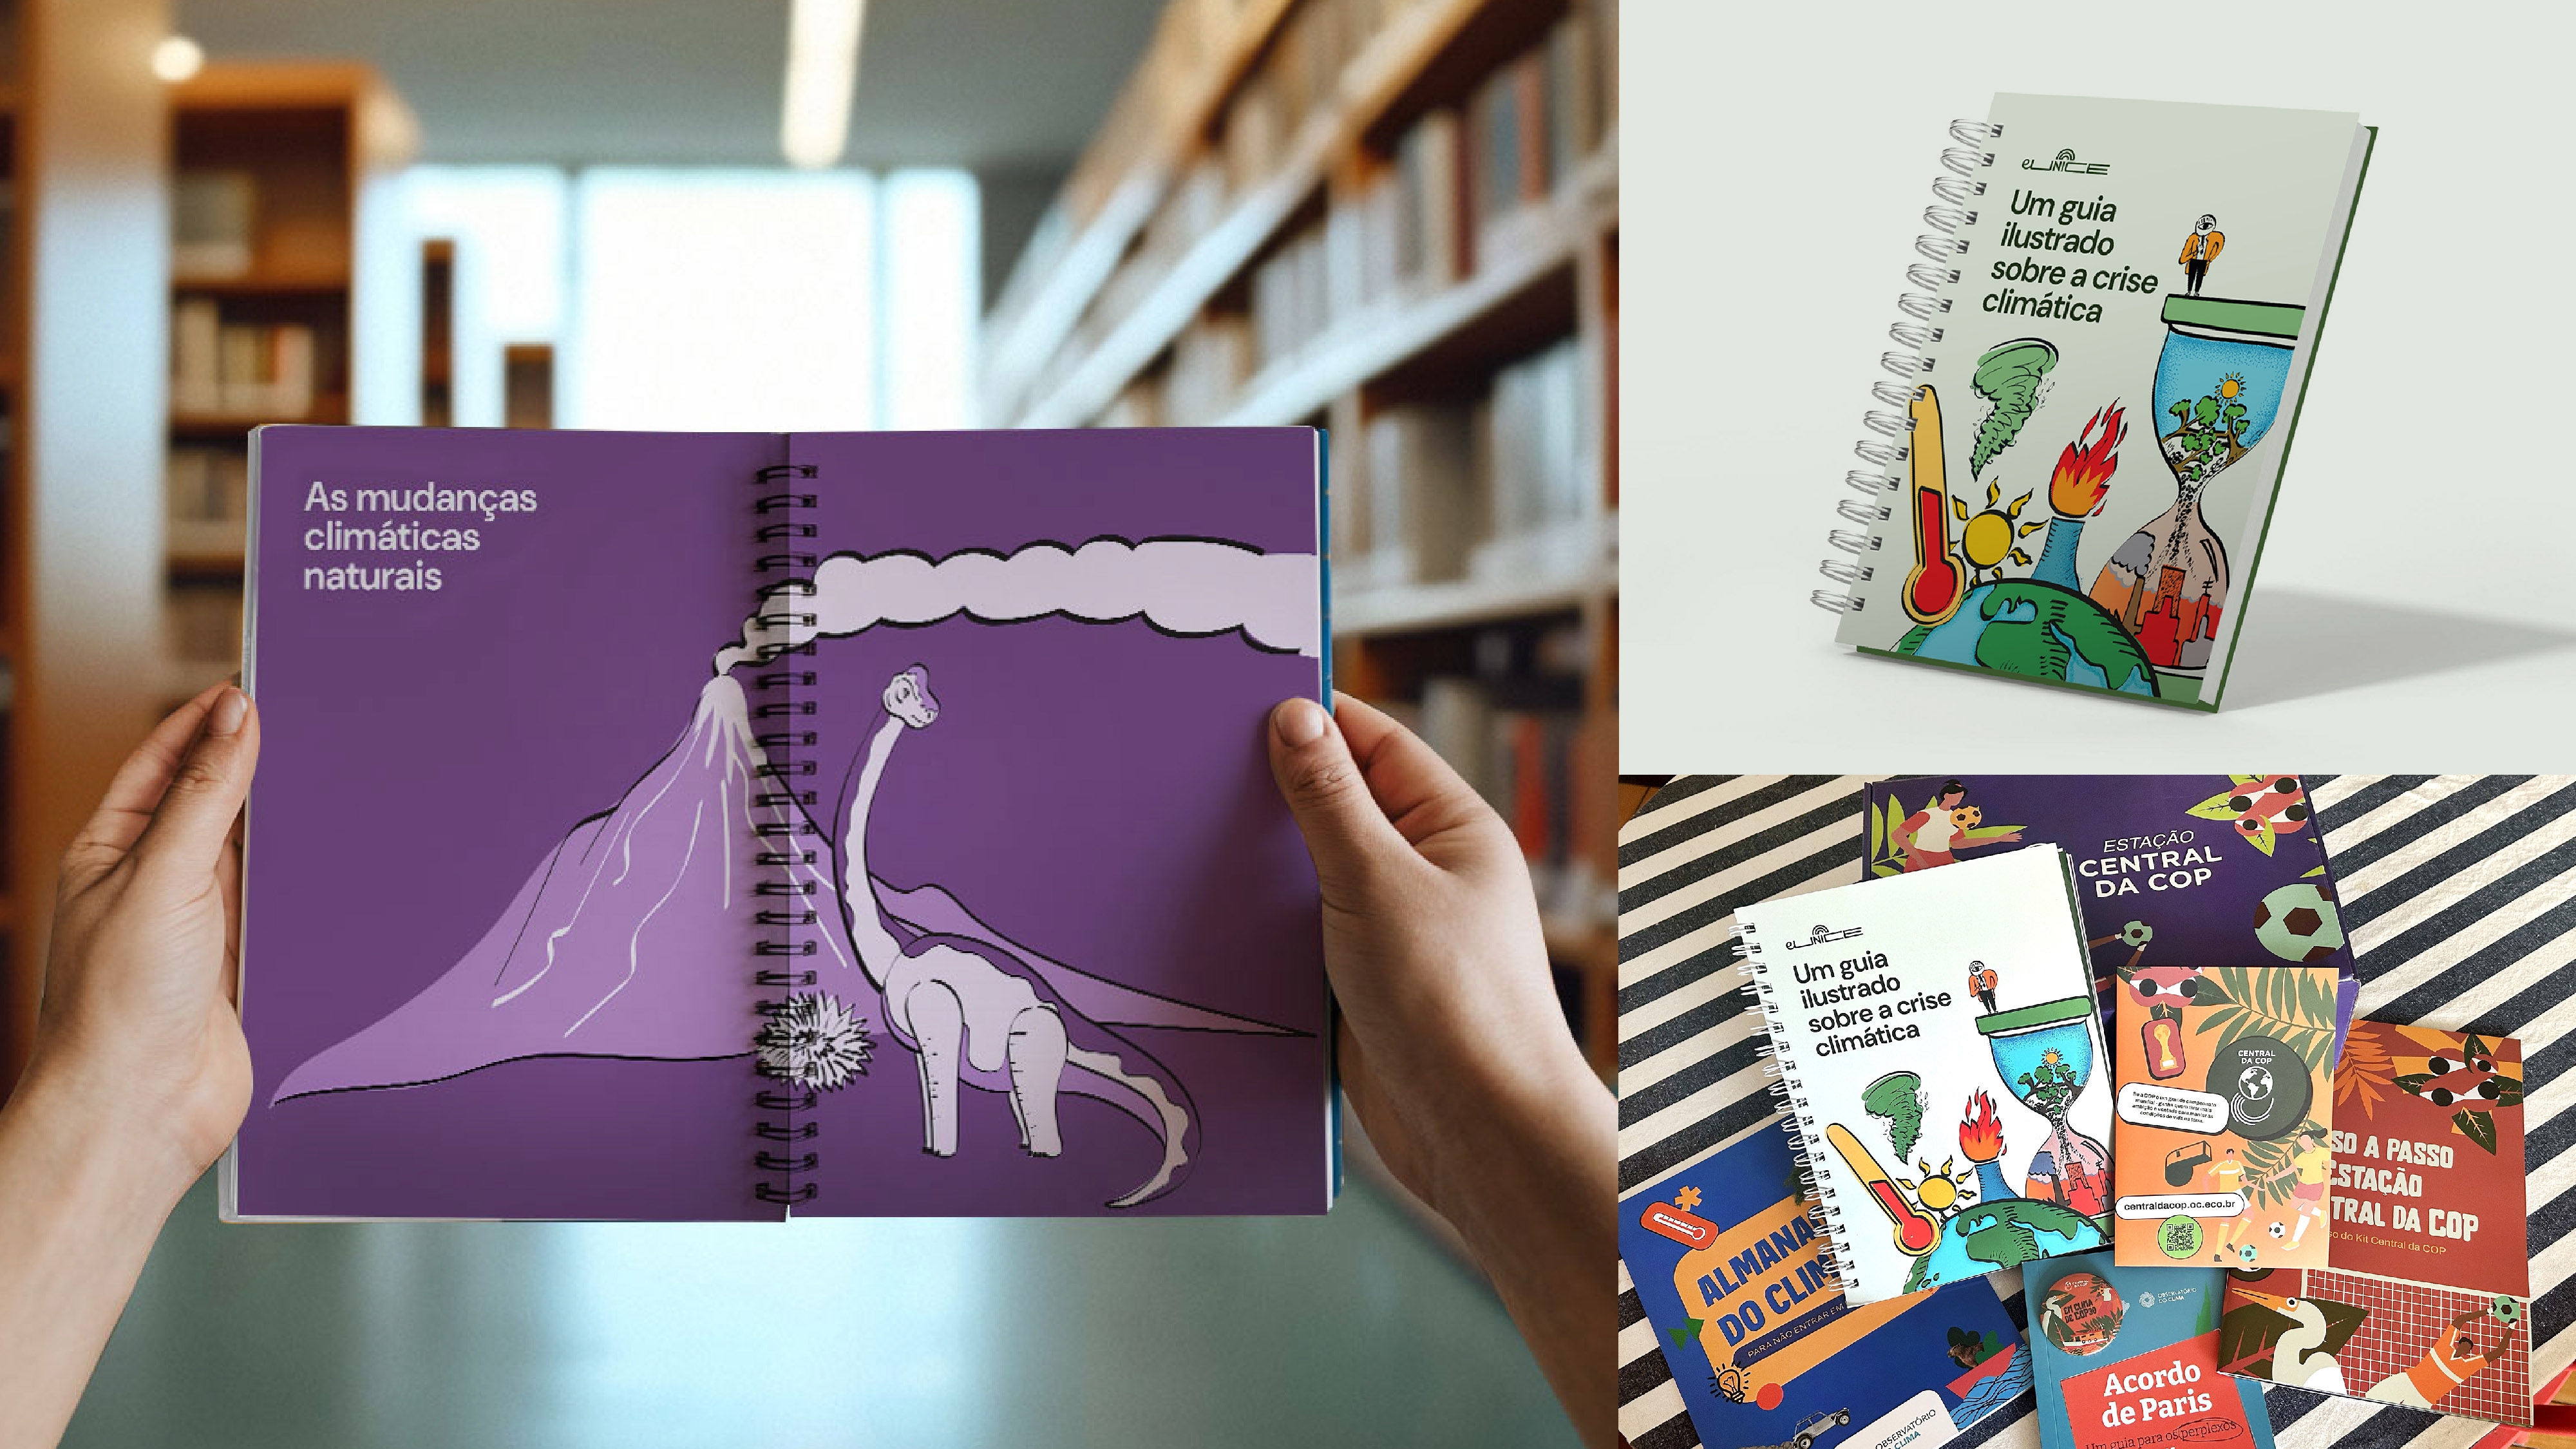
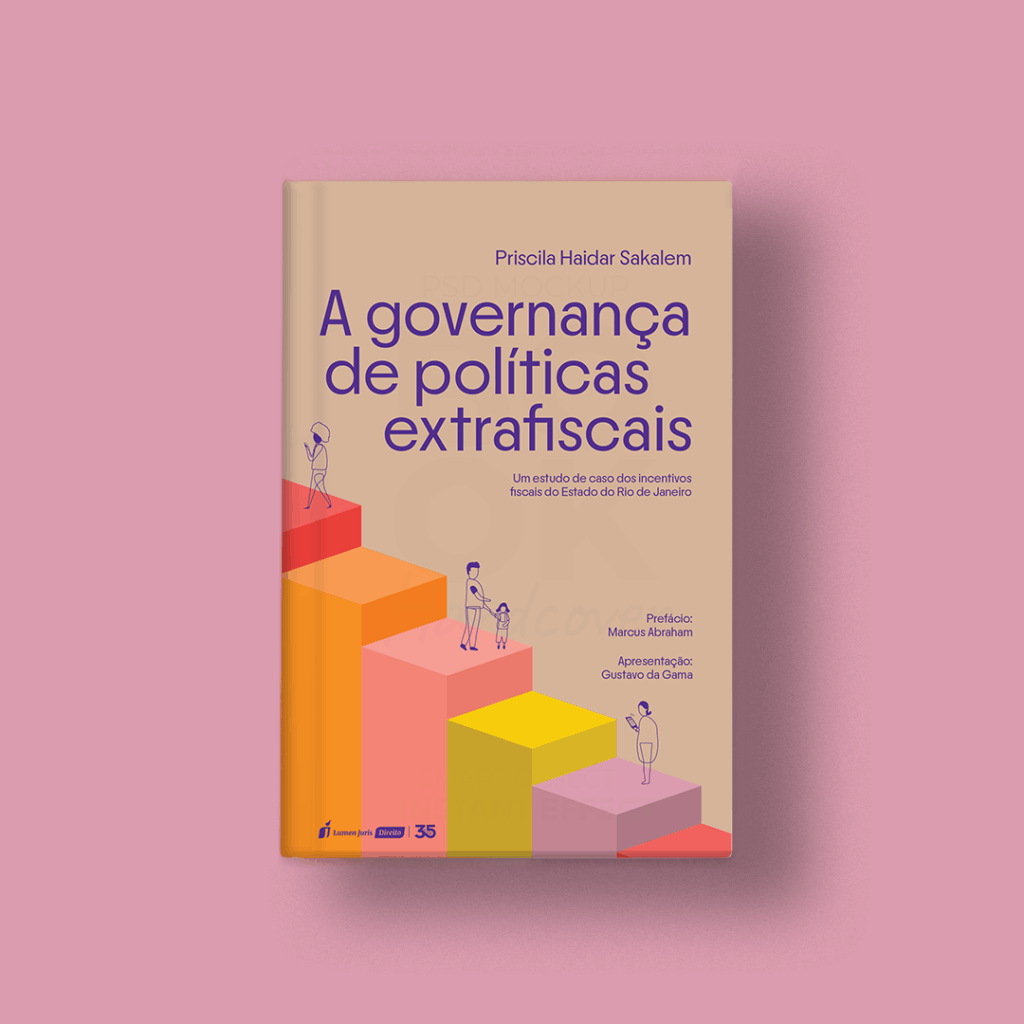
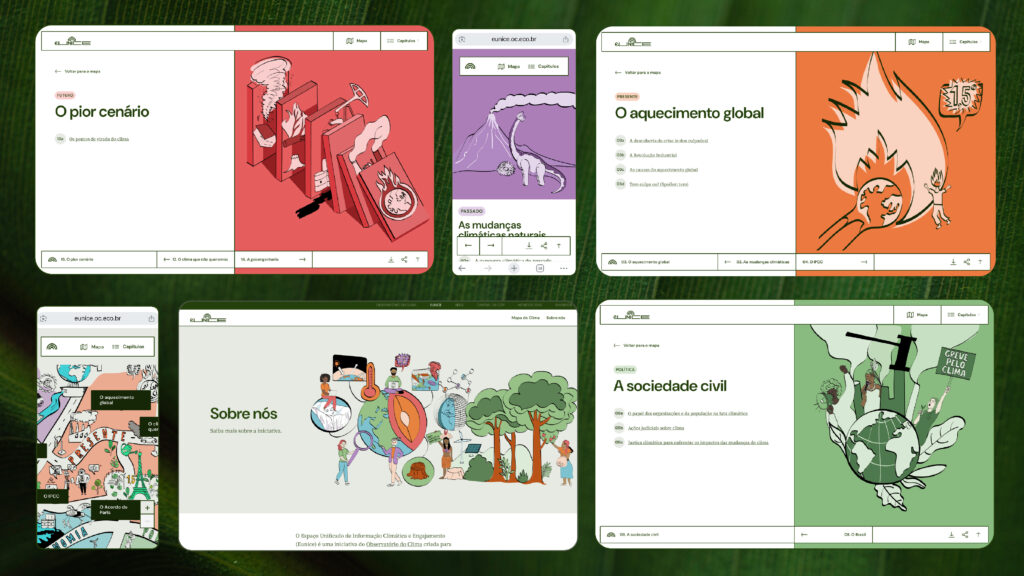
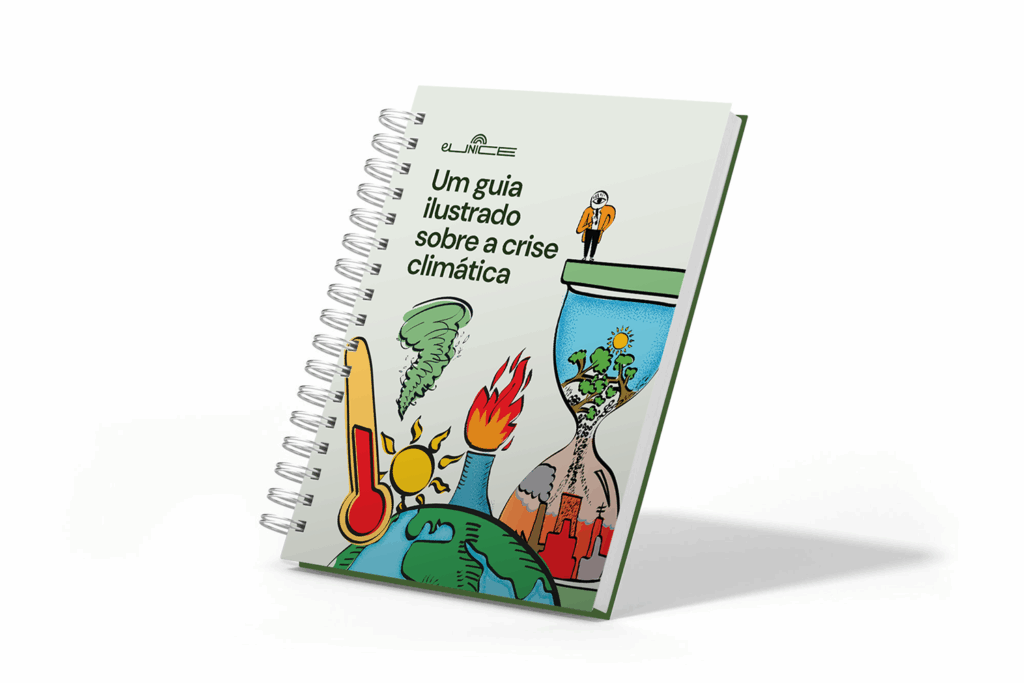
We created 120 illustrations to tell this story across 14 chapters, using a playful and ironic tone throughout the platform. In addition to the digital experience, the project was also published in print as a booklet titled An Illustrated Guide to the Climate Crisis, which is being distributed to leaders, environmentalists, and influencers ahead of COP30.
The climate map and the 120 illustrations were designed for the visual universe of the Eunice platform and its print version, the illustrated guide, which is being distributed in kits for COP30. The illustrated map serves as the entry point to the platform, as if the user were stepping into this city to navigate through different points in climate history.
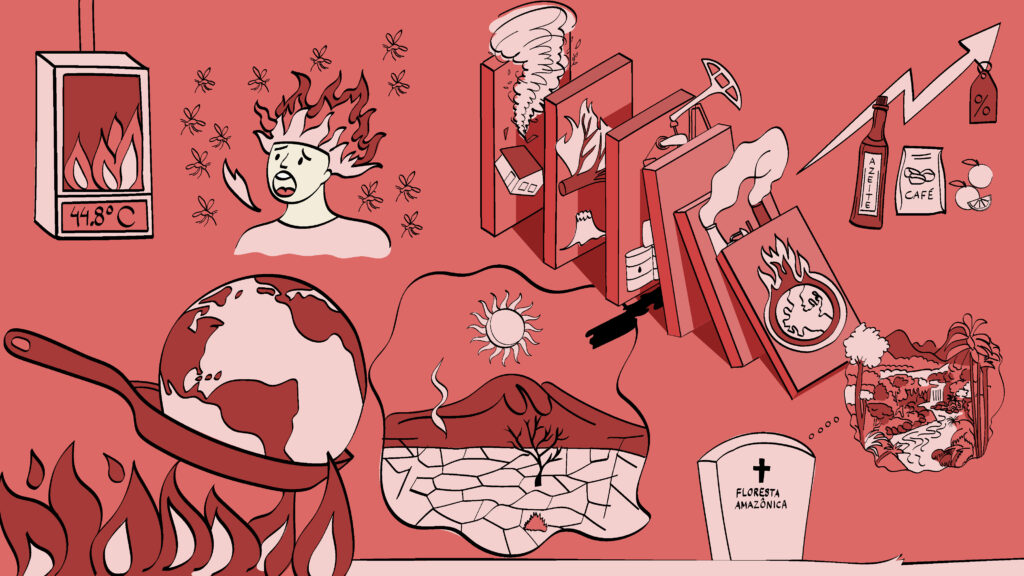
The illustrations were created digitally and inspired by political cartoons, using a critical and humorous tone to interpret a subject that is often overwhelming and paralyzing—like the climate crisis. Alongside the illustrations, the platform also features videos, infographics, audio content, and interactive tools.
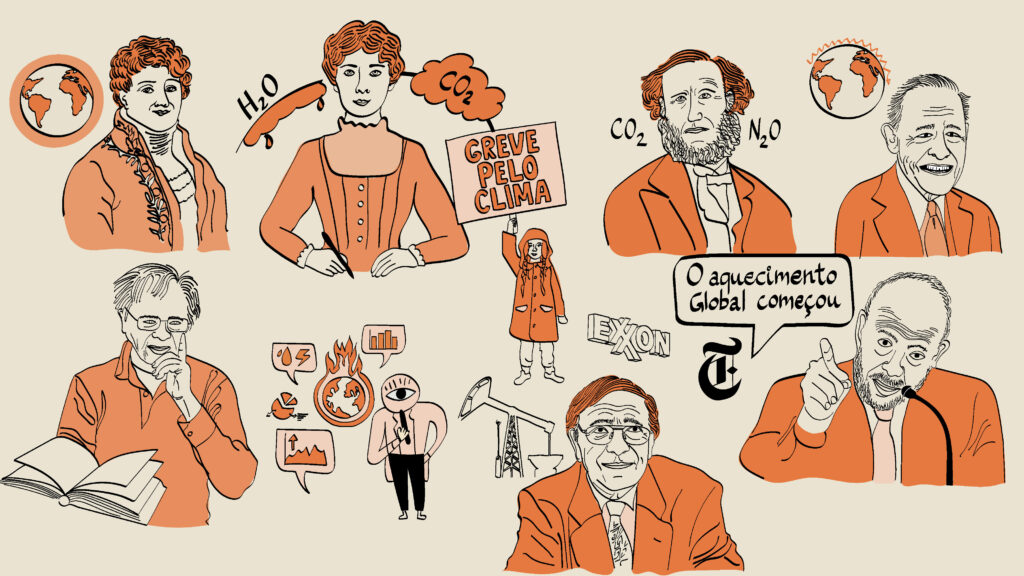
The project is named in honor of American scientist Eunice Foote, one of the discoverers of the greenhouse effect, whose contribution was erased from history simply because she was a woman.
The goal of the illustrations on the platform is to raise awareness and make the history and key data of the climate crisis clear and accessible. The idea was to use illustration to transform dense and complex content into something light, engaging, and easy to understand—reaching a wide audience: school teachers, environmental specialists, policymakers, and curious minds who want to learn more.
Eunice was conceived as a concrete contribution to the public climate debate in 2025, the year Brazil will host COP30. The platform was created to make the climate crisis easier to understand for the general public, and it will remain alive and updated over time—helping to strengthen the sense of belonging and connection to the future of the planet.
Credits:
Ilustrations: Selográfico
Visual Identity: Selográfico e Saúba
Climate Map: Selográfico
Illustrated Guide: Selográfico
Design Lead: Thiago Cruz
User Experience: Bruna Cerasi
User Interface: Natália Soueid
Infographics: Mário Kanno
UX Writing: Observatório do Clima
Development: Diego Ramalho
Guia ilustrado sobre a crise climática